
Read part one for the pre-flood story. On Friday September 30, 1983 a storm went through Arizona and especially the reservation which generated record floods. I was told Friday afternoon to go and check the gages and make flood measurements. So another technician and I left Saturday morning and headed to the this gage as we knew it was the first to peak and pass, so it was critical to get flood measurement(s).
The gage was always interesting to service as you can see from the photo in the first part during a normal non-flooding visit. It is a 1980's Arizona gage, with an A-35 graphic recorder and stage encoder linked to a GOES satellite for near-realtime data (every 2-4 hours). The box on the walkway is for the two propane heaters. Each lasts about a month and are used November through April when it's likely to become so cold the water in the small well freezes the float in place, recording and transmitting erroneous data.
I had a third tank and would stop in Pinetop to get it filled. I would replace the near empty tank started at the last visit after switching to the full tank. The line from the control switch ran into the well, spiraled down the float tape and above the float where a nozzle was lit. This heated the float sufficient to prevent freezing. As simple as it was it worked very well. And surprisingly none of the indians messed with it or stole the propane tanks.
Making discharge measurements were a little difficult as the flow was usually over and around rocks and boulders, but could usually be made somewhere immediately above or below the gage and control where you could find or make a good cross-section for a fair or good measurement (you didn't move any rocks or boulders on the gage pool control). It was always time well spent just being and working there.
Anyway, back to the flood. The neat thing about floods in Arizona is that it's only cloudy when it's raining from the storm, often a thunderstorm or a fast moving front. Once it passes, it's always sunny, so you actually measure floods when the weather is good. The storm has passed, dumped it's rain and/or snow, and moved on. And you have the highwater to deal with.
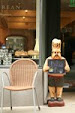
When Harry, the other technician, and I arrived late in the afternoon and the above photo was what we saw. The flow was roaring by the gage. The peak had passed, and left its mark on the propane tank cabinet, just at the three white dots below the numbers. The peak was about 1.3 feet higher than the stage at the time. We made sure the gage and data were ok, since we couldn't do much anyway if there were any damage.
After that we went just upstream to a box culvert bridge. The river was straight above the bridge before making a right turn to flow under the bridge and make a left turn just past the bridge and on to the reach flowing by the gage. In short, a horrible place to measure a flood as the box culvert was nearly full of water and with the faster flows on one side (left bank). But we didn't have a choice since there wasn't any other place.
When we were looking at the situation, this is what we saw upstream heading at the bank before turning and flowing under the bridge.

And his is what we saw downstream. The flow on the left is overflow as the normal stream channel is along the right to the gage.

The bridge had a short rail so I could use a bridge board while Harry took the field notes. This is a long extension where you have the A-reel on one end and the line extending out, over a pulley and down to the velocity meter and weight on the other end. You can either use a two wheel base or a rope to your foot to add balance and keep things from going over the rail or let loosse if you snaggged any debris - yes, it's common but mostly on the rise of floods and only rarely on the recession.
I used a rope looped around my foot I could release quickly if necessary, but it wasn't. But by the time we started to make the meaasurement it was getting dark. So Harry drove the truck to the end of the bridge and turned on the high beam headlights. And we finished the measurement in the darkness surrounding our small world. Afterward we check the gage again, mandatory, and headed to Pinetop.
We decided to come back the next afternoon after checkiing another gage and making a flood measurement at the White River near Fort Apache gage in the morning. This is required to verify the original flood measurement for the stage-discharge rating. We discovered the flow had recessed for while but was rising again with the same stage reading.
We made another measurement under the same circumstances, at the bridge and under headlights. It's the nature of the work. You not just accept it but you have to love it and respect the force of rivers. All streamgagers love their work, but not always under all circumstances. And that's the challenge of it, as well as the beauty and reward.
Months later after we did all the flood work at all the gages which had floods I took photos of the damage when the flow was back to normal, as seen below.


As you can see in the second photo the water level at the peak was at the three white dots, which was at the base of the gage house. When all the records were produced, the flood peaked at 2,700 cfs and our measurements at 985 cfs are the two highest measurements for the history of this station.
The other interesting experience was being on the reservation on a Saturday night. As we drove back to White River and then north to Pinetop, we passed a huge, maybe 40 acres, field with many groups of cars and people standing around bonfires, maybe a half dozen or so. People just hanging out and drinking. What else is there to do when there is no other entertainment and tv reception sucks? Sunday night was the opposite, just the occasional small group and bonfire, but mostly everyone home or somewhere not outside.
Such are experiences over time at gages. It's about the place, the times, and you. The rest just happens.
No comments:
Post a Comment